2024 Election Redux in Evanston: Part 1
And a weird factoid about the number of registered voters in 2020
Cook County has finally published some of the 2024 precinct level datasets. You can view them here or some of my cleaned up tables here.
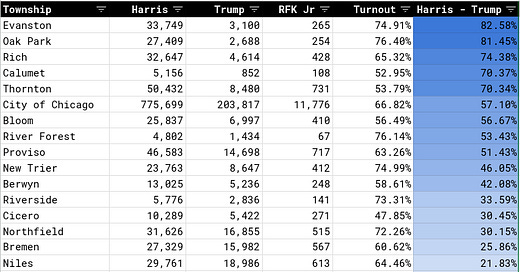
Below is a breakdown of how Cook County voted by township. Evanston remains the most blue town in Cook County, while Barrington is no longer the most red town and in fact, has gone blue this cycle. My apologies to Barrington for making fun of them. The new bastion of local conservatism is apparently Lemont, which somehow exists in three counties at once (Cook, DuPage, and Will).
You can look at Evanston from 2012 to 2024 and see it’s pretty much the same 3,000 people voting for Trump.
In the above graphic, I note the jump in registered voters with a ? - In 2020, Evanston reported 53,617 registered voters which is 10% more than they reported in 2016 and 4 years later in 2024. You can confirm it on the County’s website (2016 results, 2020 results, 2024 results) - it’s not clear to me why registered voters would jump up and back down like this.
For example: Evanston’s 3rd Ward - Precinct 1. Despite the City’s ward rezoning and shifting precinct borders, this one remains the exact same shape. This precinct includes the areas east of Chicago avenue, along the lake and is a bunch of big houses and businesses east of Chicago. There hasn’t been much development or change in this area and it doesn’t include any University dorms.
But the total number of registered voters jumped by almost 100 for 2020 and then back down to pre-2020 levels.
This makes it very hard for me to compare 2020 to 2024. Why where there just 4,000 more registered voters and where did they go? Perhaps issues at the Clerk’s office or COVID-related? I wonder if these were college students who were stuck at home during the 2020 election and have subsequently left? Comment if you know what the story is behind this.
The Roundtable reported that turnout for Harris dropped, but so did the number of registered voters. Harris had 2,781 fewer votes than Biden in 2020, but there were 4,072 fewer voters in total.
Anyway, If you ignore this variation and compare against 2016, my prior analysis, at least for Evanston, was mostly wrong. Trump did manage to gain some ground in in absolute numbers (+about 300 voters since 2016) but in terms of relative numbers, he fell behind further. But turnout, compared to 2016 was down - around 1000 voters decided to stay home this year. More Evanstonians cast votes for Hillary Clinton in 2016 than Harris in 2024.
The same consistency, didn’t hold for Cook County - looking at both Chicago and Suburban Cook together, Democrats lost about 7% to Trump since 2016.
Let me know what you think in the comments. Happy Thanksgiving and Go Lions!


![[animate output image] [animate output image]](https://substackcdn.com/image/fetch/w_1456,c_limit,f_auto,q_auto:good,fl_lossy/https%3A%2F%2Fsubstack-post-media.s3.amazonaws.com%2Fpublic%2Fimages%2Fe542415b-2aad-437e-b42a-df75d1491c33_1050x756.gif)


I haven’t seen similar national stats but it wouldn’t surprise me if many people stayed home this year. I’d like to know who the Trump voters are. Are they young? Is it true that he gained a big swath of minority votes? I’m still astounded at his win and the margin by which he won. I think it’s pretty important that we learn about why a person would pick him of all people over Harris. Those lessons need to be learned for next time. It’s clear that you can’t assume people won’t switch parties in the privacy of the voting booth. Here in political Stepford, maybe not. Also: I now have an even lower opinion of Stickney.
I did some calculations as well and saw that when you compare the 2020 percentage of Biden vs Trump with the 2024 percentage of Harris vs. Trump by ward, in 2024 Trump gained 3 points in Ward 5, 2 points in Ward 2 and 2 points in Ward 8.
Harris outperformed Biden in the rest of the city by slimmer margins, except in Ward 6 where she gained 2 percentage points and Ward 7 where she was up by 1 point.
So basically we see Trump gain in the "majority minority" and lower income wards while Harris gains in the most affluent.
I had thought we would have seen some slippage in Ward 6 and 7, but it was the opposite.