District 65's Math: i-Ready under the Microscope
Is this "Sold a Story" Part Two?
Lots of big national news this week on the math curriculum that District 65 uses: i-Ready. NBC News published a report: The revolt against i-Ready: Private equity-backed software faces parent, teacher and student fury. According to the article, one-third of elementary-aged kids in the United States use i-Ready, about 14 million students.
It’s a promise that has proved attractive to administrators seeking to boost test scores. Since the private equity-backed company Curriculum Associates released i-Ready in 2011, it has become a juggernaut. Nearly one-third of students from kindergarten to 12th grade nationwide use i-Ready, including in nine of the 10 largest school districts.
They discuss the private equity ownership issues, I wrote about this last weekend. Screen Sense Evanston reported on the litigation against i-Ready involving student data.
District 65 Math Curriculum History
Over the last ten years (2016-2025), District 65 has had 3 different math curricula, adopting i-Ready in 2022:
Pre-2020 (K-5): District 65 used Everyday Mathematics 4 (EM4) as its K-5 math curriculum, adopted districtwide beginning in 2015.
2020-21: District 65 piloted Eureka Math (owned by Great Minds / Engage NY) as its K-5 math curriculum resource district-wide, with the explicit understanding that a CAC (Curriculum Advisory Committee) review would determine whether to continue after that year.
2021-22: Eureka Math was extended for a second year, with a simultaneous one-year analysis of possible alternatives.
April 2022: After completing the review, the K-5 Math Standing Committee recommended i-Ready.
May 2022: The adoption was formally presented to the Board and approved for SY2022-23. The total cost for i-Ready would be $818,000 over five years.
i-Ready consists of three parts:
i-Ready Diagnostic: Testing app that the students use to determine math skills and provide scores. As a parent, I get an i-Ready report every few months that contains my child’s diagnostic scores.
i-Ready Core Curriculum: This is a workbook that the kids use. I have copies of this, it’s pretty standard math curricula.
i-Ready Personalized Instruction / MyPath App: iOS app designed to provide individualized-math education.
When critics say “i-Ready”, they usually mean the interactive iOS app, MyPath. I recorded a video of the app so you can see it (you might have to click thru to open YouTube).
The i-Ready app is not exactly a killer product. It’s basically a computerized testing app, but with more colors. It’s also very slow: the app reads every question to you out loud. Some questions take 30 seconds just to be able to answer. It also doesn’t feel like doing math - there’s no scratch pad or place to take notes - you have to do everything in your head. I even got a question wrong on the video above because of that!
At any time, you can just swipe the app away and do something else. Even I wanted to do that while recording the video. I don’t blame the kids for wanting to watch some YouTube.
It’s not clear how many minutes per week that District 65 students are required to use this app. A presentation given to the board in December 2024 lays out the overall math timing.
Total daily math block: 60–75 minutes per day
Whole Group phase: 5–40 minutes (grade-level instruction using the "Try It / Discuss It / Connect It" format)
Small Group phase: 20–55 minutes (targeted learning — this is where MyPath is used, alongside small groups, centers, fluency practice, and enrichment)
I’ve spoken with parents and students around Evanston and the answer varies from “only a few minutes” to “45 minutes a day.” This is not surprising, uneven compliance is a theme of the research (below). As far as I know, there is no public reporting or District-wide information available on usage.
i-Ready Research Review
There has been a lot of debate about the research supporting i-Ready. A few researchers have made some pretty bold claims:
i-Ready: 13 Million Students, Zero Meaningful Evidence - The author of this just testified to Congress on the subject.
i-Ready: the Ed-Tech Snake Oil Making Kids Dumber - This guy is doing a six part series on i-Ready. It’s pretty intense.
The push-back on those critiques is that the researchers don’t know how educational research works, and are misinterpreting the papers. So let’s go through all the (math-only) i-Ready research. I want to be a little careful, I’m not an expert on educational assessment and I don’t know those metrics well — but I spent enough time in graduate school to be dangerous — so I want to take the overall results at face value.
Worthy of note before we dive in, despite 14 million US students using it, there is not a single randomized controlled trial of i-Ready. Every piece of research compares apples-to-oranges and then using some statistical tool, usually propensity matching, to back out an effect. This is not necessarily bad, as I will argue, there are serious issues with selection bias.
Let’s go through the studies they brag about on their own website.
Johns Hopkins (2022)
This study was done in partnership with Curriculum Associates and is their most cited one. The researchers found a +0.28-0.31 standard deviation increase in test scores between students that used i-Ready and those who didn’t.
But, the experimental design had a lot of issues:
The control group and the experimental group are very different. The treatment group was 64.5% Hispanic, while the control group was 12% Hispanic. You can control for some of this, but even the authors admit they couldn’t control for English language learner status, “we controlled for as many demographic variables as possible, some, namely economic disadvantage and ELL status, were not available from all school districts involved in this evaluation”
This was run during the COVID pandemic - so this compares remote school i-Ready use vs paper instruction. Also, because of the pandemic, the standardized testing rates were lower and subject to all sorts of bias.
They threw out the 7-8th grade data because attrition was too high (i.e. the kids swiped closed the app)
To the extent this shows a result, I think you have to limit it to the dynamics of the COVID era — the learning situation was in flux between home, hybrid, and full-time. The fact they couldn’t control for ELL status when your treatment group was 64.5% Hispanic leads me to question the whole methodology.
Johns Hopkins (2023) - Striving Learners
This study was also done in partnership with Curriculum Associates — follow-up to the 2022 paper. The researchers found a +0.18 standard deviation increase in math test scores between "striving learners" (defined as scoring below 30% proficient on the fall i-Ready Diagnostic) who used i-Ready and those who didn't. Only grades 4 and 5 reached statistical significance; grades 3 and 6 were null. The experimental design had a lot of challenges:
The treatment group and comparison group are very different — about as unbalanced as the 2022 paper, just flipped. The authors acknowledge they couldn't adjust for socioeconomic status since economic disadvantage data was "not available from all school districts" involved, so it was dropped from the models entirely.
This was the 2021-22 school year, still active COVID recovery. Districts varied widely in remote/hybrid/in-person mix during this window.
Students who did not meet i-Ready's recommended usage guidelines (>30 mins 18 times a year) outperformed comparison students by 12.3 points (p<.05). As we will see below, this is the opposite of what you'd expect from low fidelity users.
I think the story you can tell is narrower: in one district during COVID recovery, for students who were very under-performing, there was a small increase in 4th and 5th grade math scores but not seen in 3rd or 6th grade.
WestEd (2019)
This study was also done in partnership with the Silicon Valley Education Foundation and supported by the Bill & Melinda Gates Foundation. This is one of the few independent studies (e.g. no Curriculum Associates collaboration).
The qualitative findings are pretty shocking. Consider this story they tell about a student, Walt.
Walt was positively interactive, jubilant and celebrating (quietly) when he got the award that accompanies correct answers on [a competitor’s product]. Even when he got an answer wrong, he still went through the hints to figure out why. When he got to i-Ready he became still, almost motionless.
Or enforcement issues for teachers;
Teacher B hypothesized that the students went into "game" mode with the test and stopped being as thoughtful and careful as she knew they could be, instead treating it like a video game. Students themselves said they would become fatigued and reported just guessing at times.
The students that used the product the most grew to hate it;
The most vocal and nuanced critiques of i-Ready came from the students in District B, School 1, Teacher B's class. This is perhaps because they were such heavy users of i-Ready (averaging 78 minutes per week)
Despite the power-users hating it, the quantitative finding was positive: students who used i-Ready for 45+ minutes per week scored 24 points higher on a Grade 7 math assessment than similar students who used it less. The Grade 7 SBAC scale spans 528 points (2250–2778), so 24 points is about 4.5% of the range.
The experimental design is .. interesting. They are not comparing i-Ready to not i-Ready, they compare more i-Ready to less i-Ready.
45+ min/week (12% of students) vs <45 min/week: +24 points
30+ min/week (22% of students) vs <30 min/week: +19 points
15+ min/week (50% of students) vs <15 min/week: +7 points
This design has some issues. I spent two hours fighting with this and here’s my fundamental complaint: enforcement was classroom-based, so students were non-randomly assigned to groups based on teacher compliance abilities. Even then, of all the students that started, a non-random 12% of kids made it into the 45 min/week category. Only 22% made it into the 30 min/week category. Those are some low numbers. The fact that the scores go up, as the size goes down suggests to me some kind of selection bias. My gut is that in the high compliance settings, the teachers were acting as educational supplements.
HumRRO (2020)
This study was conducted by the Human Resources Research Organization (HumRRO) and Century Analytics in partnership with Curriculum Associates. The finding: “striving learners” in grades 2–5 (students placing two or more grade levels below on the fall i-Ready Diagnostic) who used i-Ready math with fidelity scored 3.6 to 5.5 scale-score points higher on the spring (i-Ready) Diagnostic. Their sample was large: 103,350 students nationally.
The test group here are only students who used i-Ready with fidelity - meaning an average of ≥30 mins for 18 weeks. The control group are students who didn’t use i-Ready’s instructional product. There is no data provided on students who used i-Ready but were in the <30 mins/week bucket (e.g. not meeting fidelity).
The authors conclude this finding meets Department of Education guidelines for evidence-based research (ESSA), but concede that randomized controlled trials should be conducted.
We recommend randomized control trials (RCTs) in the future and collecting implementation fidelity information from treatment schools as well as collecting information about programs within comparison schools that might be similar in nature to i-Ready. We suggest including only one district to allow greater control of implementation and fewer confounds.
I am not willing to throw this one out — but the results only apply to 2-5th graders who are already two grade levels behind and are forced to meet fidelity compliance with the app. I would argue the reason they saw an effect is because i-Ready is acting as a poor man’s tutor. For students two grade levels behind, the student needs remediation to catch up and this is better than nothing.
Curriculum Associates - Young & Young (2025) and LASO Texas (2025)
I’m bundling these two studies together: [1] and [2]. Both are written by Curriculum Associates staffers and not in a journal or publication. So take this with a grain of salt.
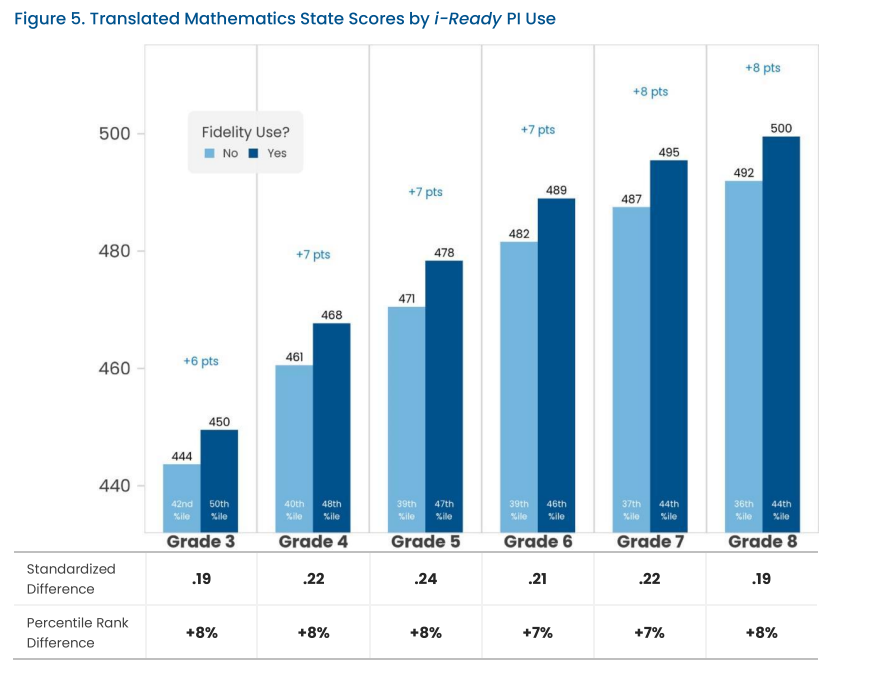
For Young & Young, like the HumRRO study above, they’re comparing high fidelity students (≥30 min/week + 70% pass rate + ≥18 weeks) against low fidelity. We’re back to comparing more i-Ready to less i-Ready.
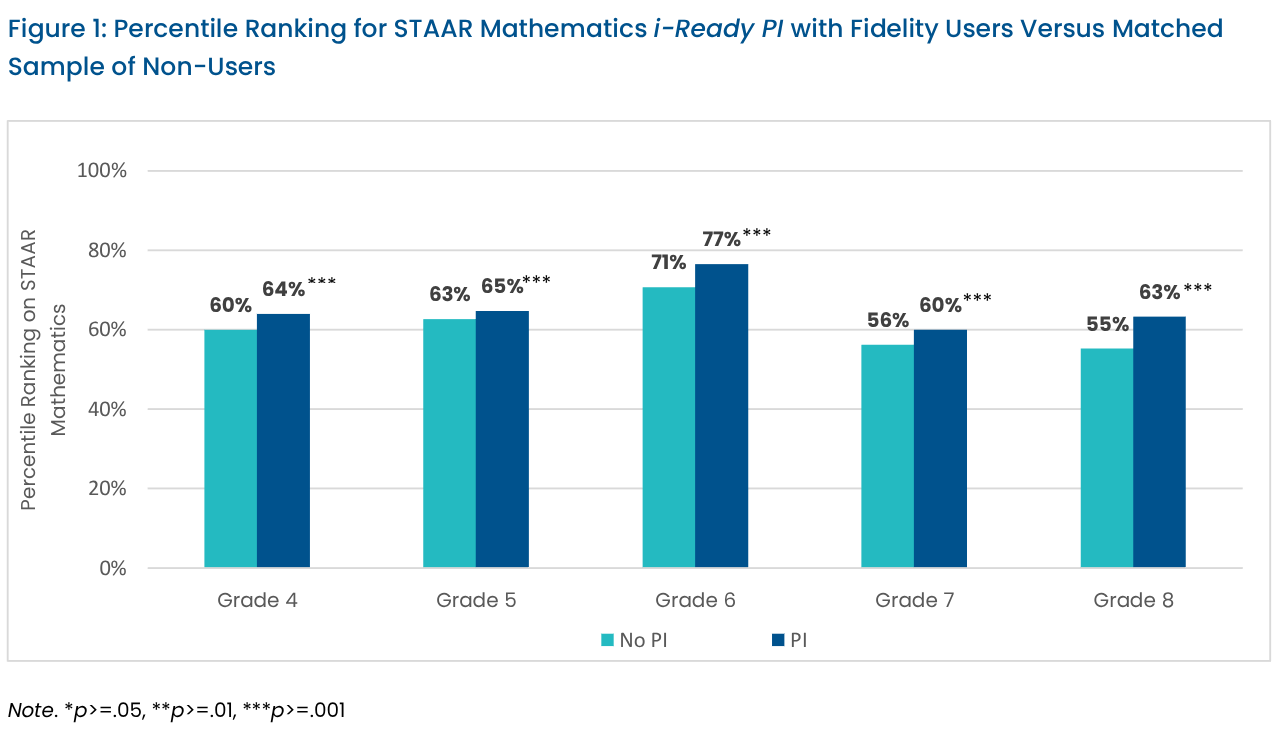
For the LASO study, they compare high fidelity users against non-users.
Bear with me on a thought experiment here: I’m a bad tennis player and probably a worse tennis instructor. Suppose I started offering weekly tennis lessons. ≥45 mins a week for 18 weeks. 100 people register but after a year, there are only 12 people left in the class.
At the end, I assess the skill levels and say, “Look! People who did ≥45 mins a week of my crappy tennis class for 18 weeks are better tennis players than those who left! If people take my class with full fidelity, they will become better tennis players.”
But in reality, it’s the people who either already loved tennis, had incredible patience, were afraid to leave, or were already skilled who stuck around. Perhaps the students helped each other in the absence of my skills. I have not proven anything about my tennis class, just things about the type of person who self selected into the high fidelity group. This is selection bias.
A researcher here would say, “Sure Tom, but if you do propensity weighting for their incoming skills, then you can back this out.” And that’s abstractly true, but how do you propensity weight for intangibles like patience or grit or students/teachers helping out? Then you get into this statistical game of trying to find more variables to add to the matching, such that you can get to a positive result.
It’s not just these studies doing that, almost all of them commit to some form of this logic.
That’s it for the studies - there’s really not much more besides a few dissertations (which show no results), N<100 sample sizes, and stuff on the ELA i-Ready, which I don’t cover here. You can do the analysis on your own — I put all the papers into this Google Drive folder. None of these papers share data publicly.
My Thoughts: Big Waste of Time
For a program that has been deployed to 14 million US school children, at great cost, this research is very unconvincing. Here’s my argument, in order of severity:
There are no randomized controlled trials, just a bunch of attempts to shoehorn observational studies into “quasi-experimental” studies.
Except one, every piece of i-Ready research was post-hoc and paid for or conducted by Curriculum Associates: the students used the tools and then afterwards analyzed. How did selection of schools work? Did they cherry pick districts?
There is almost no discussion of the selection bias issue. Students can swipe away at any moment to watch YouTube or surf the web, and clearly most of them did. Compliance depended on teacher enforcement and I suspect many of the teachers tutored the kids through the app.
Even the published studies with an effect, the effect was limited to specific cases: students who were severely behind or remote COVID learners. There’s almost no results for most general education students.
Even if you forget about all the experimental issues and take every study at face value — the findings are still pretty weak. There’s no landmark study or deep bench of evidence. I see a vendor that had a hard time getting results at the 15-30 mins level and started requiring ≥45+ minutes/week (high fidelity) to obtain very weak results using observational studies. At best, it’s a low-quality math tutor that the kids and teachers hate.
If fidelity is what matters, then every study is asking the wrong question. If the students have to spend ≥45 mins a week for 18 weeks - what is the alternative use of that time? Is it better spent with hands-on instruction? The control group in almost all these studies is essentially “screwing around on the tablet” (e.g. not meeting fidelity). It’s not shocking to me that playing tedious math games would outperform watching YouTube.
Back in 2021, the University of Chicago did a study of i-Ready. It found no difference between those who used i-Ready and those who didn’t (back then the branding was just “Ready Classroom Mathematics”). From their website:
The math scores of students who used the curriculum were similar to those who did not.
The analyses indicated that students who used Ready Classroom Mathematics scored comparably in math to students who did not. Although not statistically significant, there was suggestive evidence that certain student groups – namely English language learners and students with disabilities – may find Ready Classroom Mathematics particularly beneficial for improving their math learning.
While I emotionally think we should punish i-Ready, ditch all their products and join the litigation — we’ve already changed the curriculum 3 times in 10 years. The paper i-Ready curriculum is pretty average math curriculum and even Curriculum Associates is hedging after the Los Angeles technology resolution:
At Curriculum Associates, this isn’t a pivot—it’s a principle we’ve held from the beginning. We are, first and always, a curriculum and instruction company (yes, it’s in our name). For more than 50 years, we’ve focused on strong curriculum, skilled teaching, formative assessment, and meaningful student engagement, whether through print materials, discussion, or guided practice.
The solution is pretty simple - for next year, ditch the iPad math block and replace it with literally anything else. The body of evidence suggests the kids would get more enrichment at recess or making paper airplanes or plain old math instruction.